Understanding Your GLP-1 Medication Levels
Track your Zepbound and Wegovy medication levels to understand effectiveness and side effects
That gap between biological reality and lived experience is where a lot of anxiety lives. And it’s completely valid. When you’re navigating something like Zepbound, Wegovy, or Mounjaro, you’re not just managing a medication schedule — you’re trying to interpret signals from your own body in real time, without a clear reference point for what working is supposed to feel like. That’s exactly the problem this free tool was built to solve.
So let’s talk about the Medication Levels feature in Glapp — what it does, how it works, and why we think it changes how people relate to their treatment.
What the chart actually shows
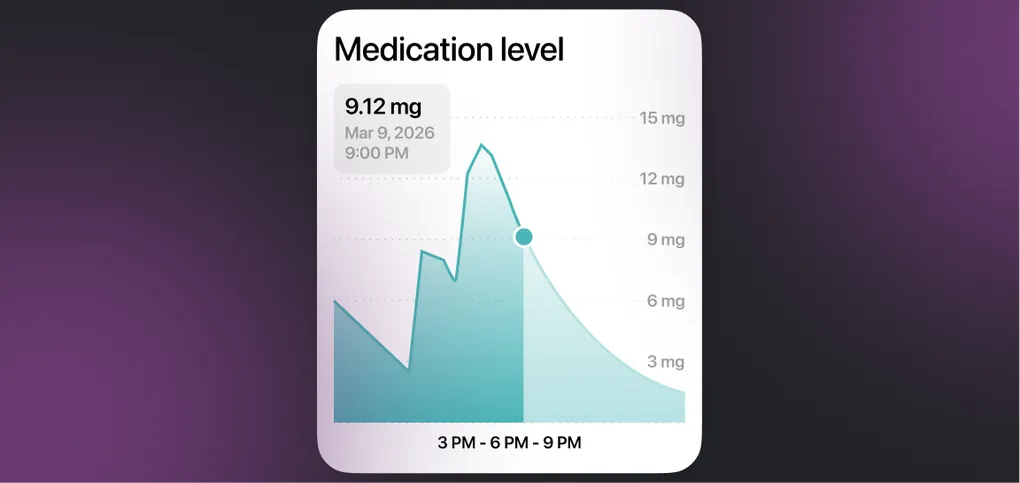
The Medication Levels chart shows you an approximation of how much of your GLP-1 medication is in your system at any given point in time.
When you log your injections in Glapp, the chart uses published pharmacokinetic data from FDA clinical reviews and peer-reviewed research to draw an estimated curve of how your medication behaves over time.
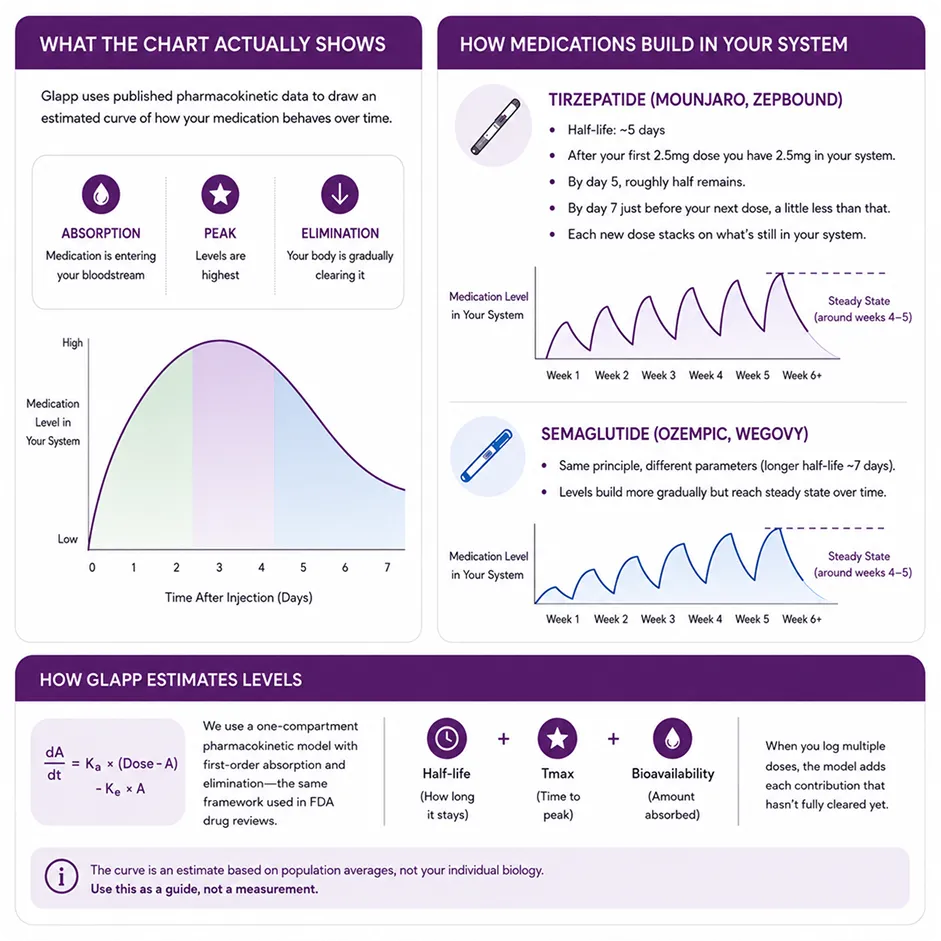
It models three phases that happen after every injection: absorption (when the medication is entering your bloodstream), peak (when levels are highest), and elimination (when your body is gradually clearing it before the next dose).
For tirzepatide (Mounjaro, Zepbound), the half-life is roughly 5 days. That’s why one of the most common questions we see in support requests is what to expect after the first dose of Zepbound. After your first 2.5 mg dose you have 2.5 mg in your system. By day 5, roughly half remains. By day 7, just before your next dose, a little less than that. Each new dose stacks on what’s still in your system. Week by week, levels build.
Around weeks 4 to 5, your peak and trough levels stabilize and you hit what clinicians call steady state. That’s also usually when people stop asking how long it takes for Zepbound to suppress appetite, because they start feeling it consistently. The curve in Glapp shows exactly this buildup, week by week.
For semaglutide (Ozempic, Wegovy), the same principle applies with slightly different parameters. When does Wegovy start working? is probably the most common question we get — and the chart makes the answer intuitive. You can literally see your levels rising toward steady state.
How Glapp estimates levels
We use a one-compartment pharmacokinetic model with first-order absorption and elimination — the same framework used in FDA drug reviews. For each medication we pull three published values: half-life, time to peak concentration (Tmax), and bioavailability. When you log multiple doses, the model adds each contribution that hasn’t fully cleared yet.
We want to be transparent about the limits here. Real people process GLP-1 medications differently based on body size, metabolism, and a dozen other factors we cannot know from an app. The model uses published population averages, not your individual biology. Think of the curve as a well-informed estimate, not a measurement.
How this helps you in practice
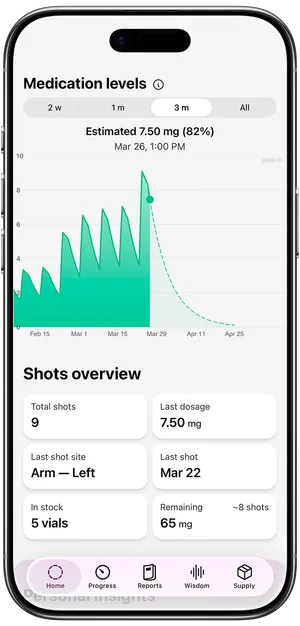
To make the medication level chart as accurate as possible, the most important thing is consistent dose logging. Track each injection when you give it, including the dose amount. Glapp uses your dose history to build the curve, so gaps or imprecise logging will affect what you see.
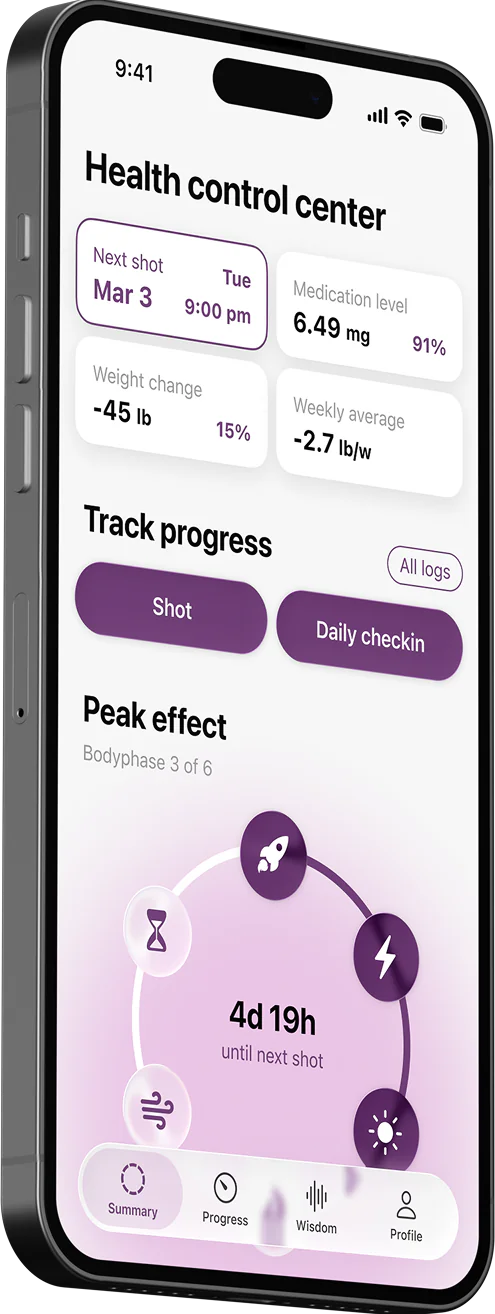
Logging symptoms against the curve is where this feature becomes genuinely powerful. Side effects like nausea tend to cluster in days 1 to 3 post-injection, when levels are climbing. Food noise and hunger often creep back in days 4 to 7 as levels drop toward trough. When you log symptoms daily against your curve, you stop second-guessing yourself and start seeing real patterns.
And for everyone asking can I stay on a low dose of Wegovy? — the chart helps here too. If your trough levels still feel effective, that’s meaningful information to bring to your provider. You can see visually how much remains in your system before each dose, and whether you’re reaching steady state at your current dose.
We hope this explanation has helped you understand the power of tracking your GLP-1 medication levels. Understanding how your medication behaves in your body can be a powerful tool when it comes to managing your weight loss, anticipating side effects, and making informed decisions with your doctor.
Ready to start seeing your medication levels? Just log your injections in Glapp, and let our Medication Levels feature bring more clarity to your weight loss therapy.
See your medication levels clearly
References
- FDA Center for Drug Evaluation and Research. Tirzepatide Clinical Pharmacology Review.
- FDA Center for Drug Evaluation and Research. Semaglutide Medical Review.
- Coskun T. et al. Pharmacokinetics, pharmacodynamics, safety and tolerability of GIP, GLP-1 and glucagon receptor agonists. Diabetes, Obesity and Metabolism.