GLP-1 Dosage Plotter for Tirzepatide and Semaglutide
100% free. Done in 4 easy steps!
Plot your Mounjaro, Wegovy, Ozempic dosing over time so you can see how doses rise, overlap, peak, and fade across weeks.
Plot Your Dose


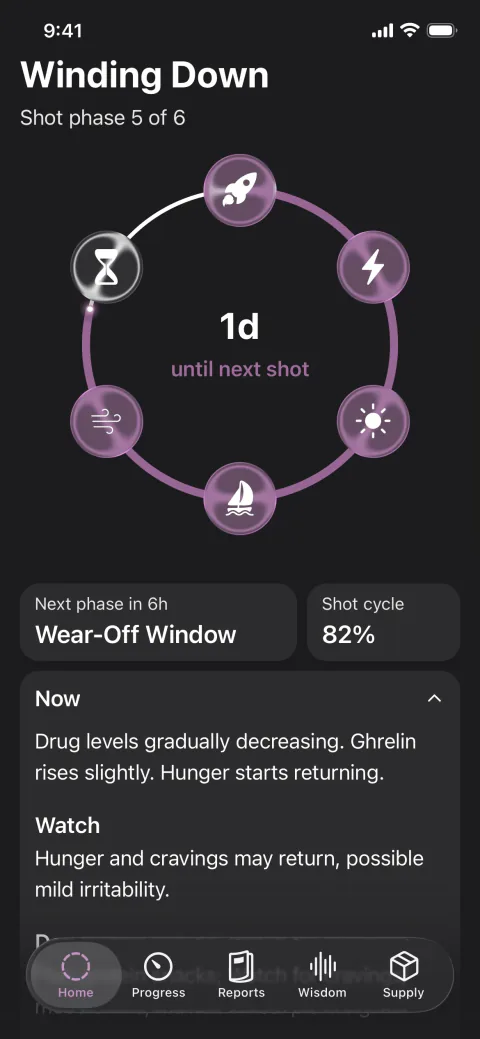
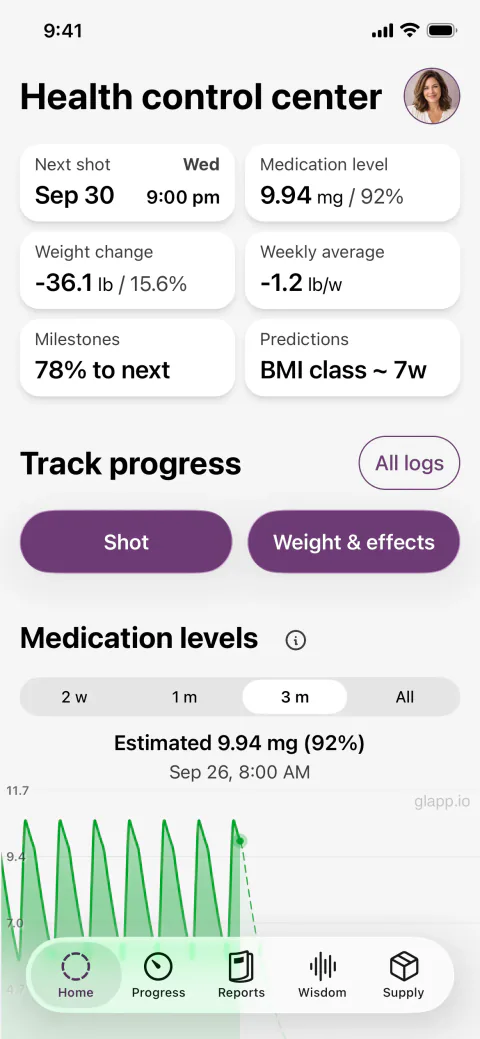
How to Plot Doses Chart
Select your medication and format
Choose tirzepatide or semaglutide, including Ozempic, Wegovy, Mounjaro, and Zepbound. The plotter also models retatrutide — RUO (Research use only).
Enter your dose and schedule
Input your weekly dose, titration steps, or microdosing pattern. The tool works with standard dosing charts and flexible schedules.
Visualize the medication level over time
See how medication levels build, peak, and decline based on pharmacokinetic data.
Save or share your chart
Plot side-by-side scenarios, including semaglutide to tirzepatide dose conversions, to better understand relative dosing patterns.
Frequently Asked Questions
Answers to common questions about Glapp GLP-1 Plotter
What is a GLP-1 dosage plotter?
A GLP-1 dosage plotter is a visualization tool that shows how semaglutide or tirzepatide doses change over time, including weekly dosing, overlap, and half-life effects.
Can this tool replace my doctor's dosing advice?
No. This tool does not provide medical advice or prescribe doses. It is designed to help you understand dosing patterns, charts, and comparisons so conversations with your healthcare provider are clearer.
Does the plotter support semaglutide, tirzepatide and retatrutide — RUO (Research use only)?
Yes. It models semaglutide and tirzepatide schedules, including Mounjaro, Ozempic, Wegovy, and Zepbound. Retatrutide — RUO (Research use only) — is available for research modeling only.
Can I use this for compounded GLP-1 medications?
The plotter can visualize compounded dosing schedules for educational purposes, including compounded tirzepatide dosage patterns. Always verify formulation details with your provider or pharmacy.
Does this include microdosing charts?
Yes. You can plot microdosing patterns for semaglutide or tirzepatide to see how smaller, more frequent doses affect weekly exposure.
Can I compare doses between medications?
The tool allows visual comparison between semaglutide and tirzepatide dosing patterns, including common conversion scenarios, to help you understand relative exposure — not to determine equivalence.
How the GLP-1 Dosage Plotter Calculates Medication Levels
This plotter uses a one-compartment pharmacokinetic model with first-order absorption to estimate how GLP-1 medications behave in the body over time.
Instead of showing a single dose in isolation, the chart calculates how each dose overlaps with previous doses, helping you visualize buildup, peak effect, and gradual decline across weeks.
Each medication is modeled using established pharmacokinetic parameters:
- Half-life (t½) — The time it takes for the amount of drug in the body to decrease by 50%.
- Bioavailability (F) — The fraction of the injected dose that reaches systemic circulation.
- Volume of Distribution (Vd) — The apparent volume into which the drug distributes throughout the body.
- Tmax — The estimated time to reach peak concentration after an injection.
At any point in time, the plotted value represents the sum of residual amounts from all previous doses.
Data Sources
Pharmacokinetic parameters are derived from publicly available regulatory and clinical sources:
- Semaglutide — FDA NDA 209637, Clinical Pharmacology Review
- Tirzepatide — FDA NDA 215866, Clinical Pharmacology Review
- Retatrutide — RUO (Research use only). Phase 2 clinical trial data (estimated).
Additional references — DrugBank (Semaglutide), DrugBank (Tirzepatide)
Important Notice
This plotter provides theoretical estimates based on population pharmacokinetic data. This tool is for educational and visualization purposes only and does not provide medical advice. Always consult a qualified healthcare professional for dosing and treatment decisions.