












Semaglutide Ozempic®, Wegovy®
- Half-life
- ~7 days (1 week)
- Time to peak (Tmax)
- 1–3 days after injection
- Steady state
- 4–5 weeks of consistent weekly dosing
- After the final injection
- Present in circulation for about 5–7 weeks
Glapp bridges the gap between science and your daily routine, turning complex semaglutide and tirzepatide pharmacokinetics into personalized daily insights.
Sources we use
Glapp translates published evidence into 5 practical tools:
Pharmacokinetics describes how a medication is absorbed, distributed and eliminated from the body. One important measure is its half-life: the approximate time required for the amount of medication in the body to decrease by half during elimination.
Glapp charts your estimated tirzepatide and semaglutide level between doses using published half-life data. It combines your logged doses and injection times with a simplified absorption and decay model.
Glapp’s estimated medication-level curves are educational models based on published population averages. They are not direct blood measurements (assays). Glapp does not tell you when or how much to inject — always follow your prescribing clinician’s exact protocol.
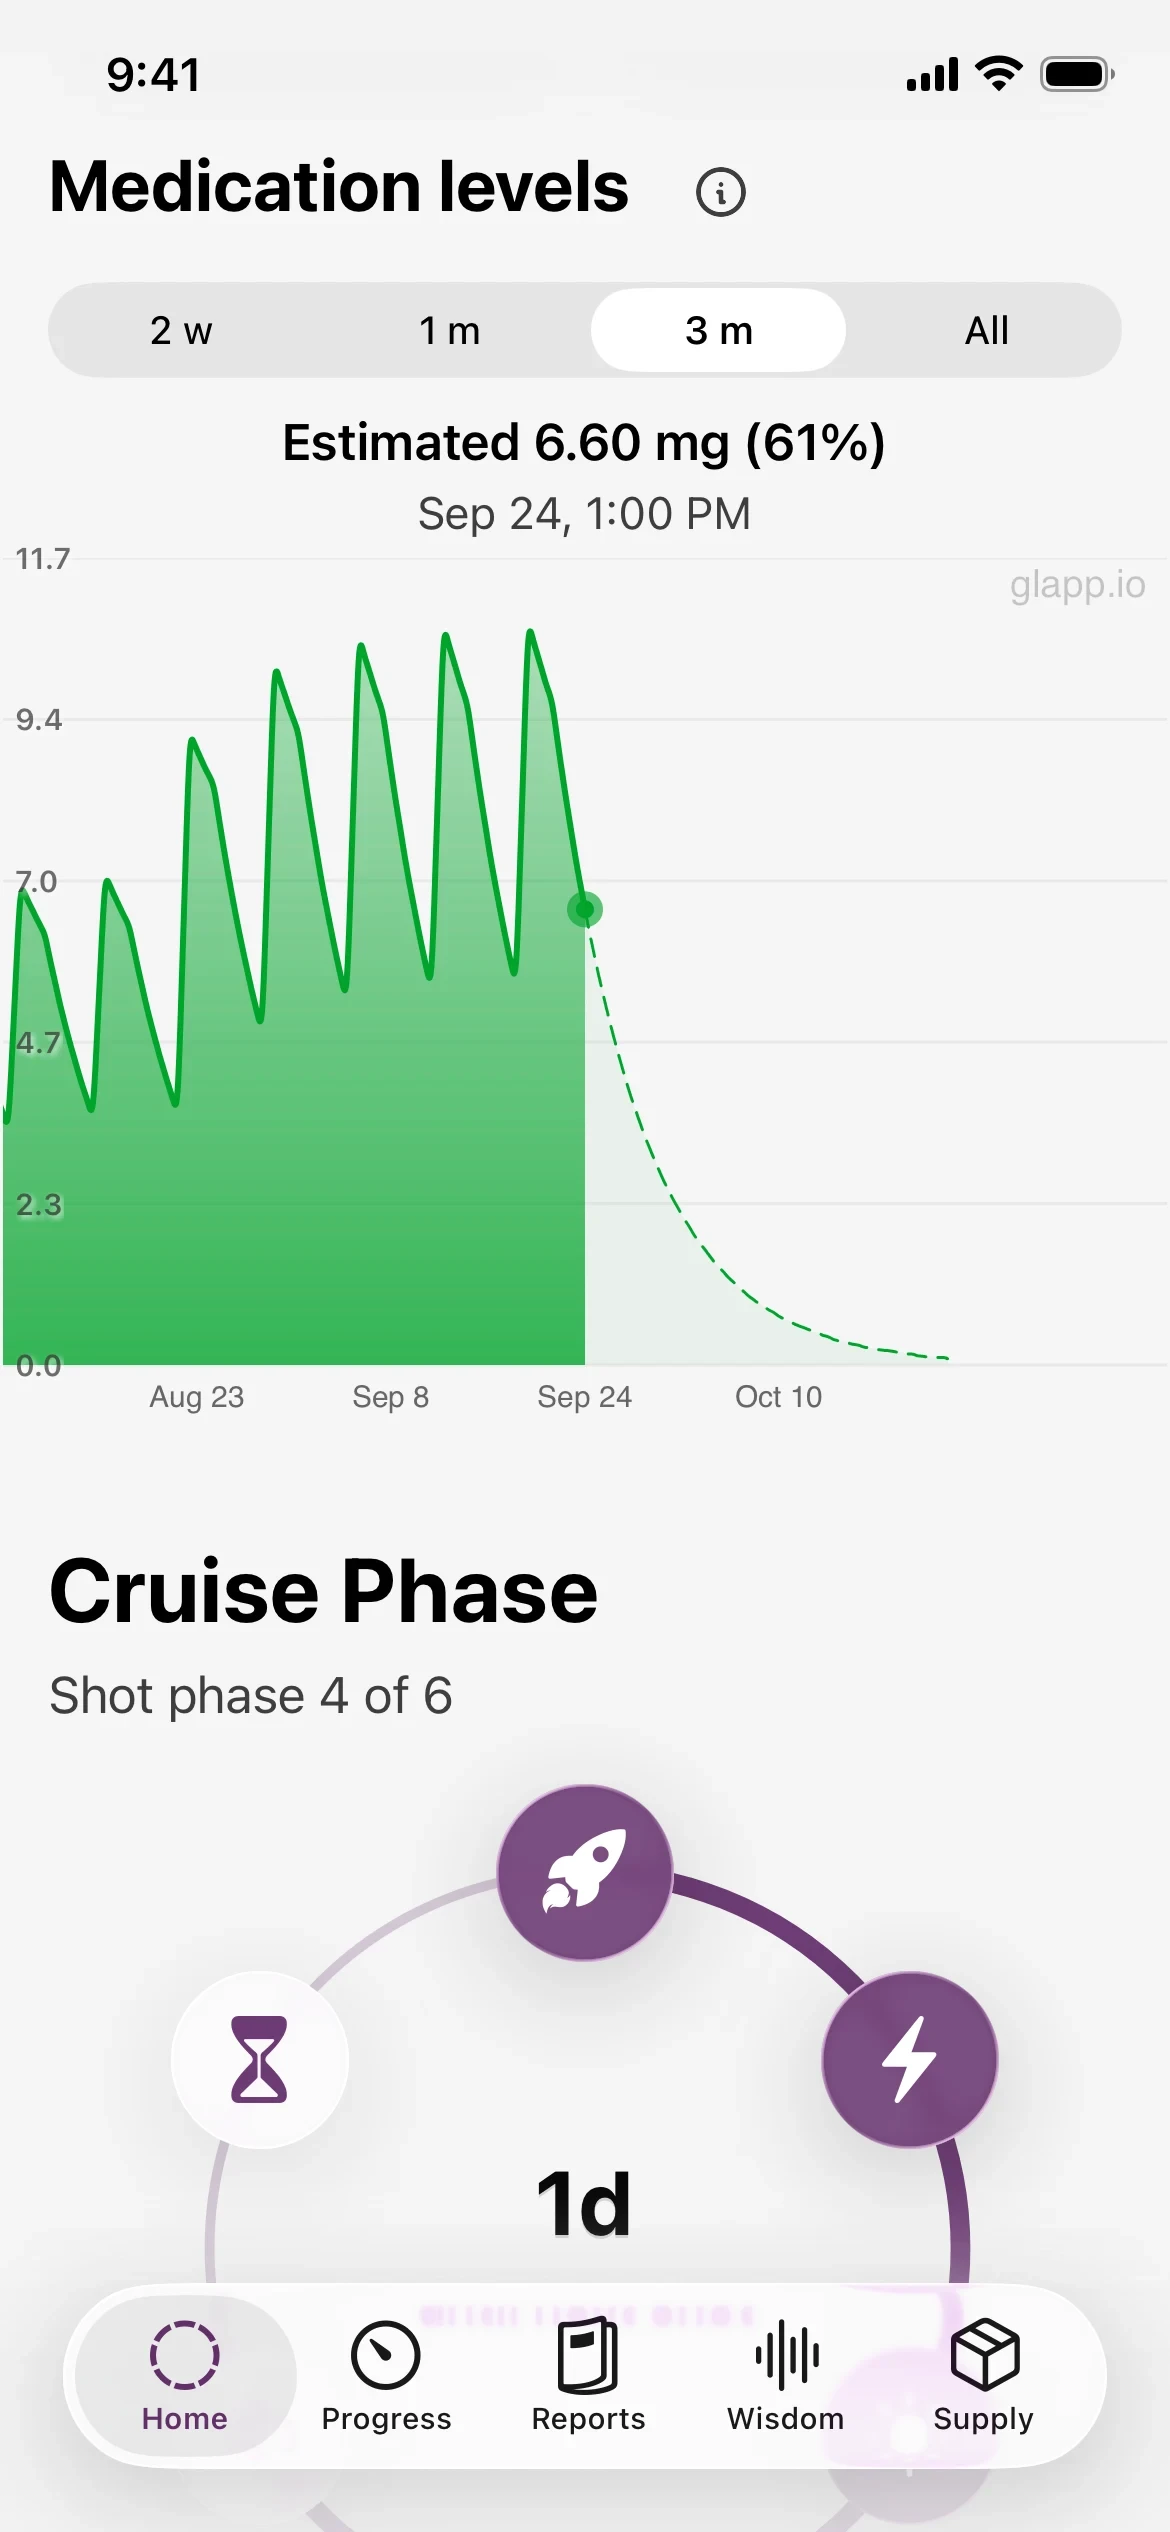
These are approximate periods, not exact clearance deadlines. Ozempic prescribing information describes about five weeks in circulation after the last dose; Wegovy describes about five to seven weeks. The tirzepatide estimate uses the general rule that most of a dose is eliminated after about five half-lives. Individual elimination varies.
Retatrutide (investigational, research use only) has an approximately six-day half-life. Peak and steady-state timings are not listed here.
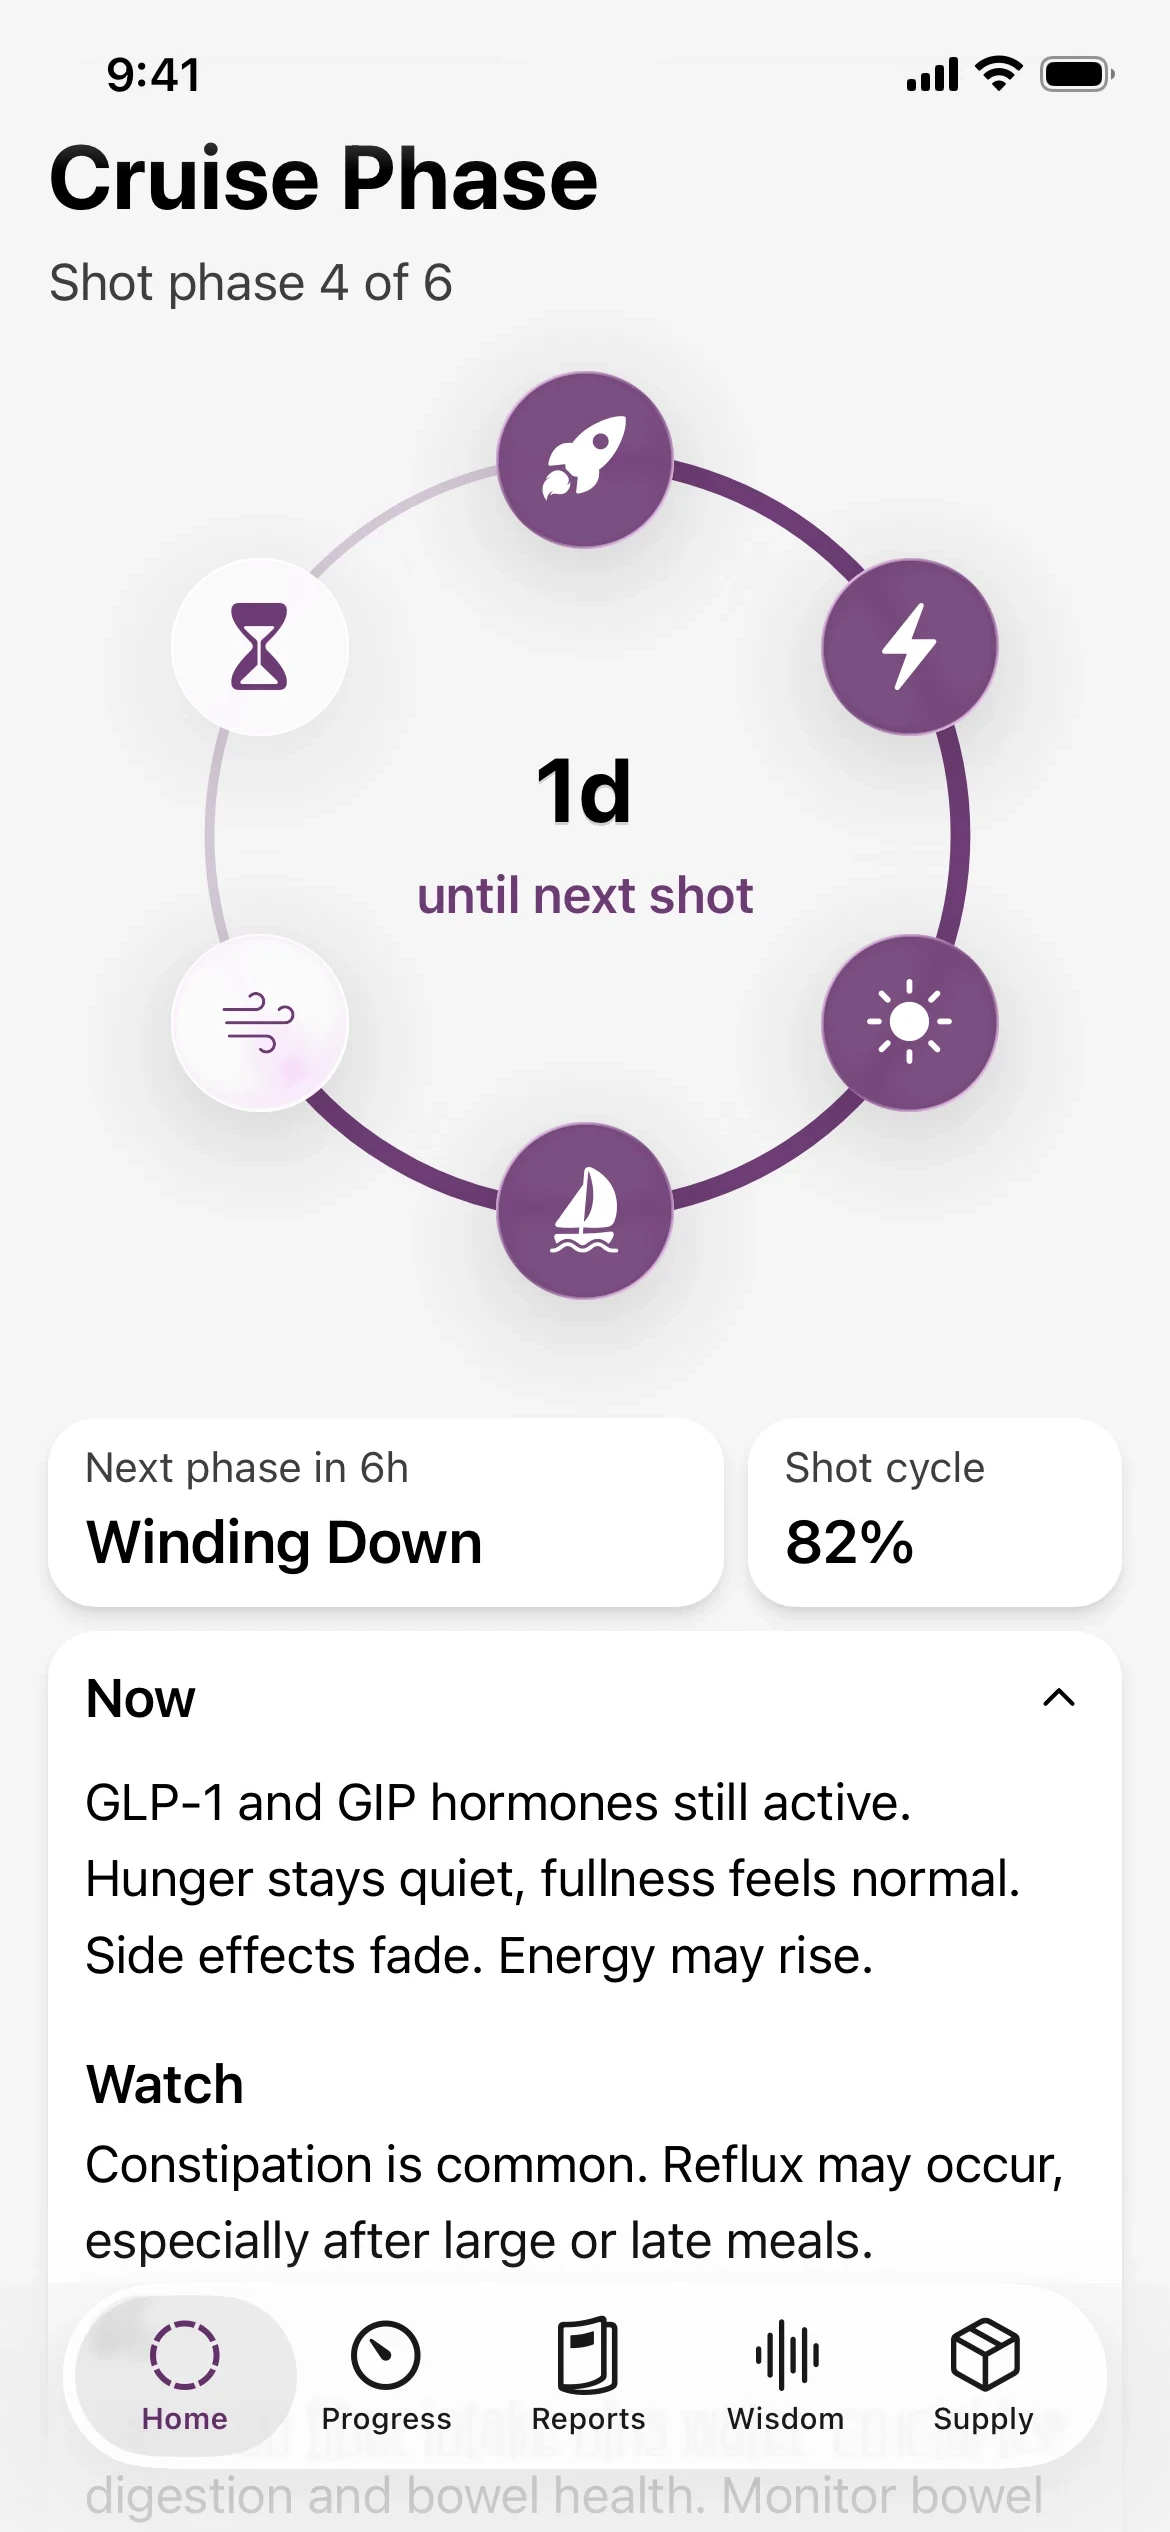
Like most drugs, GLP-1 medications move through predictable phases in the body — activation, peak effect, and a gradual fade. Glapp’s GLP-1 injection tracker visualizes that pharmacokinetic cycle after every shot. Log an injection, and Glapp shows your current phase in the shot cycle.
The goal: a clearer picture of your therapy, so you feel more informed and more confident in it.
Log hunger, mood and side effects throughout your week. Your entries add personal context to the shot cycle and help you reflect on patterns to discuss with your care team.
Phase names and time windows are Glapp’s educational framework. Studies do not establish these exact boundaries or predict when you personally will feel hungry or experience side effects.
| Phase | Semaglutide | Tirzepatide |
|---|---|---|
| Activation | 0–6 h | 0–6 h |
| Taking Effect | 6–24 h | 6–24 h |
| Peak Effect | 24–72 h | 24–72 h |
| Cruise Phase | 72–120 h | 72–144 h |
| Winding Down | 120–144 h | 144–156 h |
| Wear-Off Window | 144–168 h | 156–168 h |
Hours since your last shot on a once-weekly schedule. Retatrutide (research use only) uses a longer Cruise Phase and a shorter Wear-Off Window.
There is no single normal GLP-1 weight-loss trajectory. Response can differ according to medication, dose, treatment duration, starting weight, health conditions, adherence and individual biology.
Glapp’s GLP-1 progress tracker lets you view your logged weight alongside published group-average curves from major clinical-trial programs, including STEP, SELECT, SURMOUNT and TRIUMPH.
Results are not directly comparable across studies. The trial’s percentage weight changes are applied to your starting weight. These curves show group averages. Your own progress may differ.
Shading shows the area between group averages, not the range of individual results.
Explore the studies used in our charts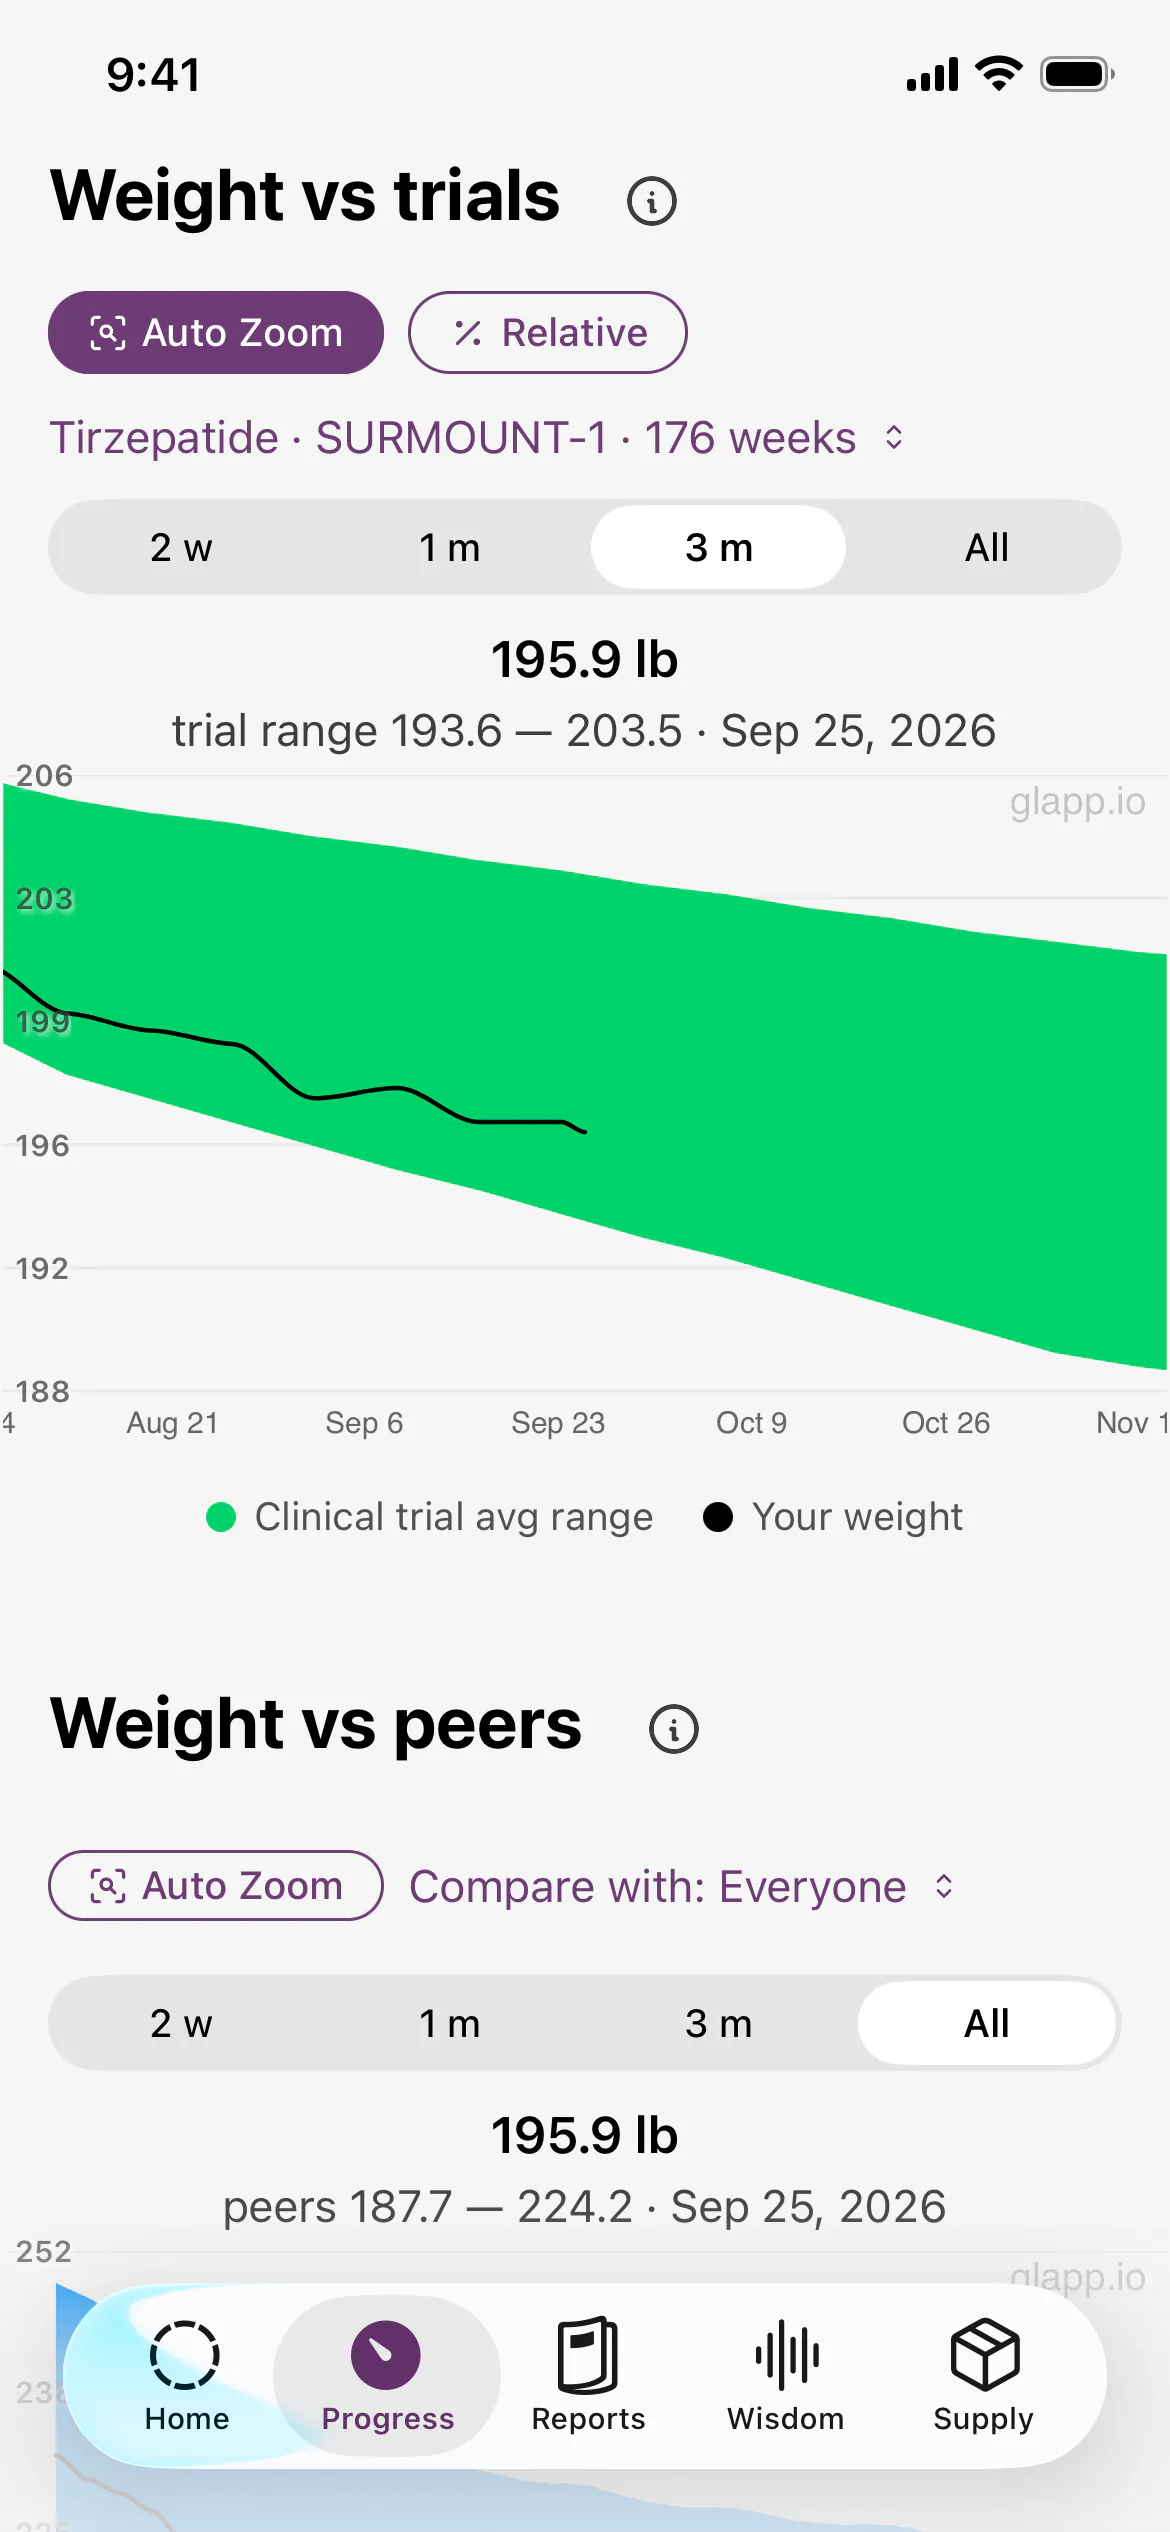
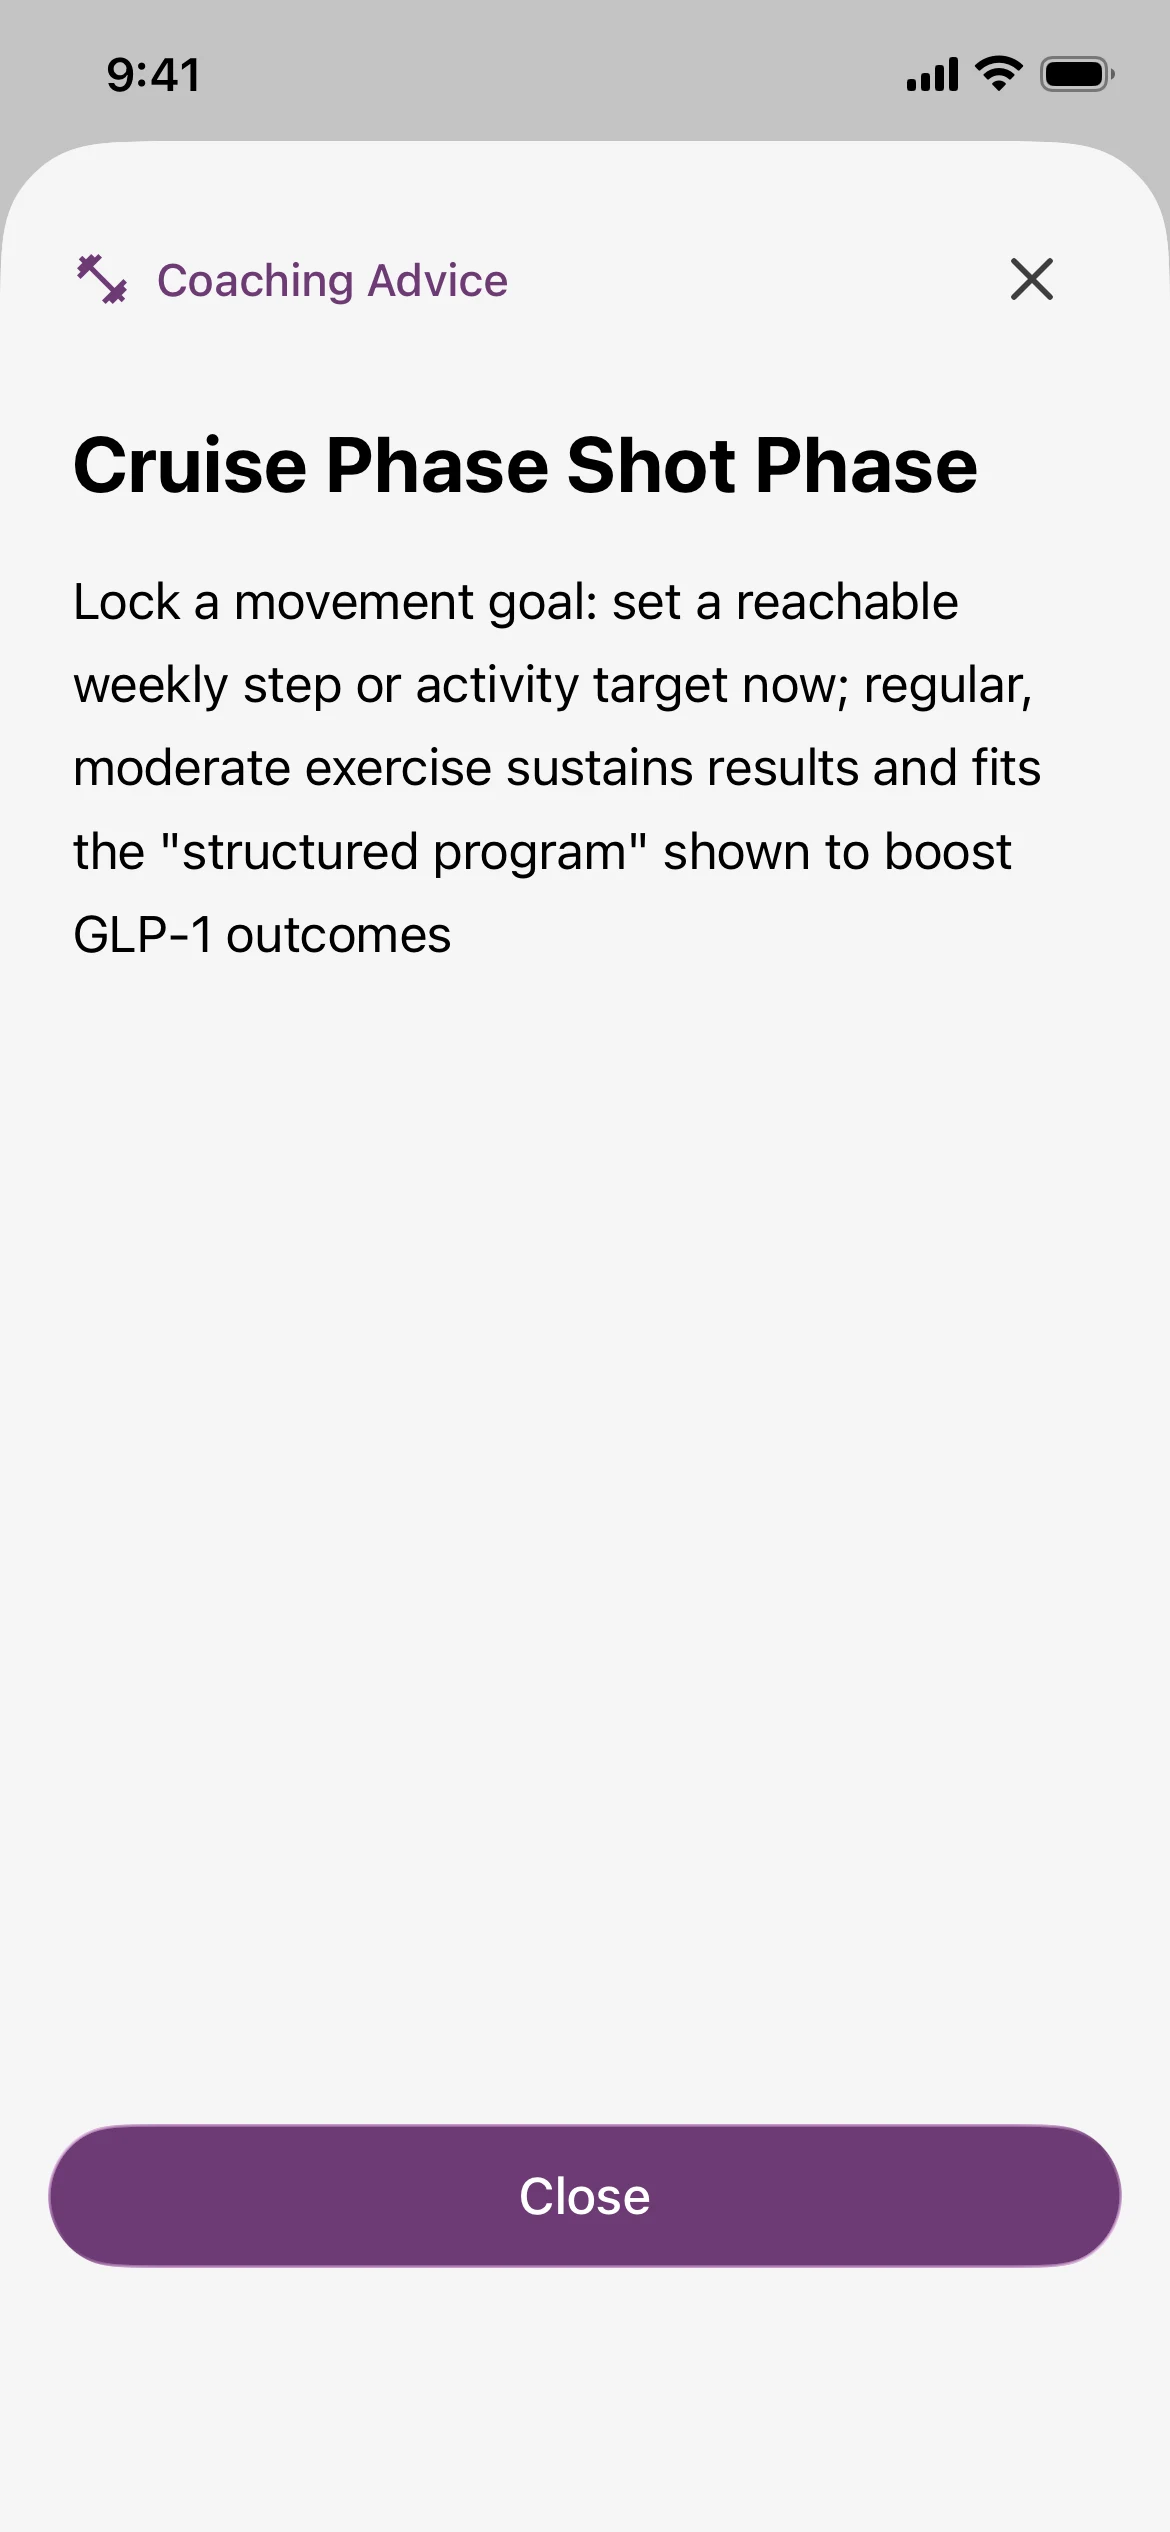
Once you start logging injections, Glapp surfaces personalized nutrition tips and coaching advice timed to your current Shot Phase. These suggestions are grounded in official guidance from the American Society for Nutrition (ASN), The Obesity Society (TOS), the American College of Lifestyle Medicine, and the Obesity Medicine Association.
Eating less can make it harder to get the nutrients your body needs. The 2025 joint advisory informs our educational guidance on food, hydration and preserving muscle. The cards turn everyday habits — like balanced meals and regular movement — into practical reminders for your week.
Your needs depend on your health, appetite and treatment. General guidance and phase tips are starting points for a conversation with your clinician or dietitian.
Read the joint nutrition advisory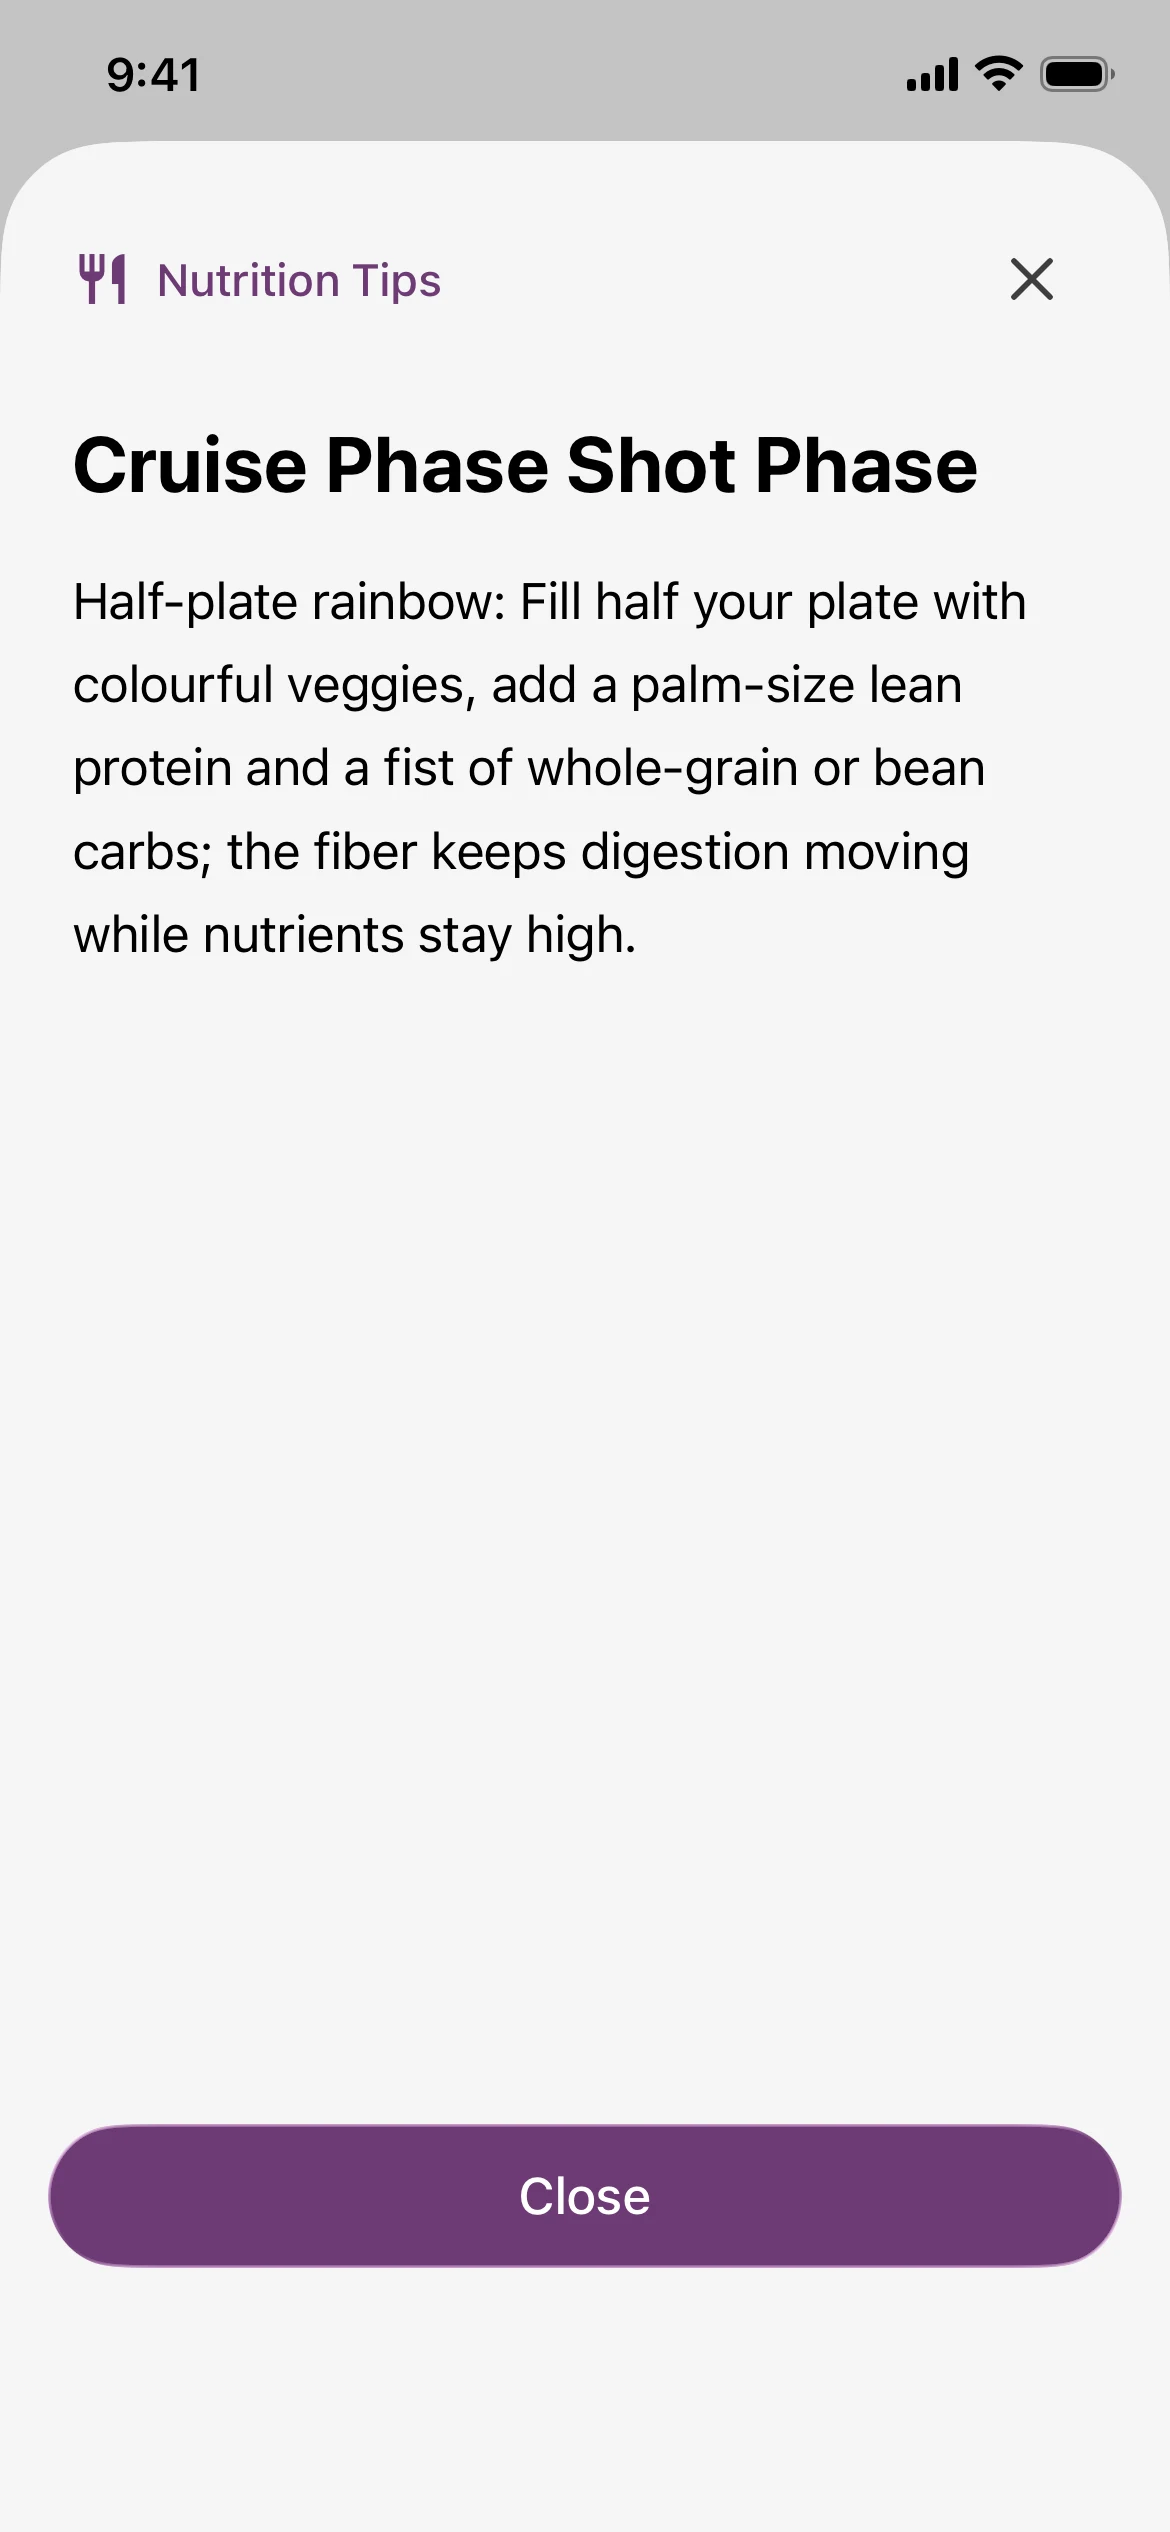
Wisdom searches clinical trials, peer-reviewed research and scientific studies to help answer your questions about GLP-1 medications, weight loss, side effects and treatment progress.
Wisdom provides general educational information, not personalized medical advice. Research findings may not apply to every individual, and answers should not be used to diagnose a condition or change your medication or dose.
View the answer's source list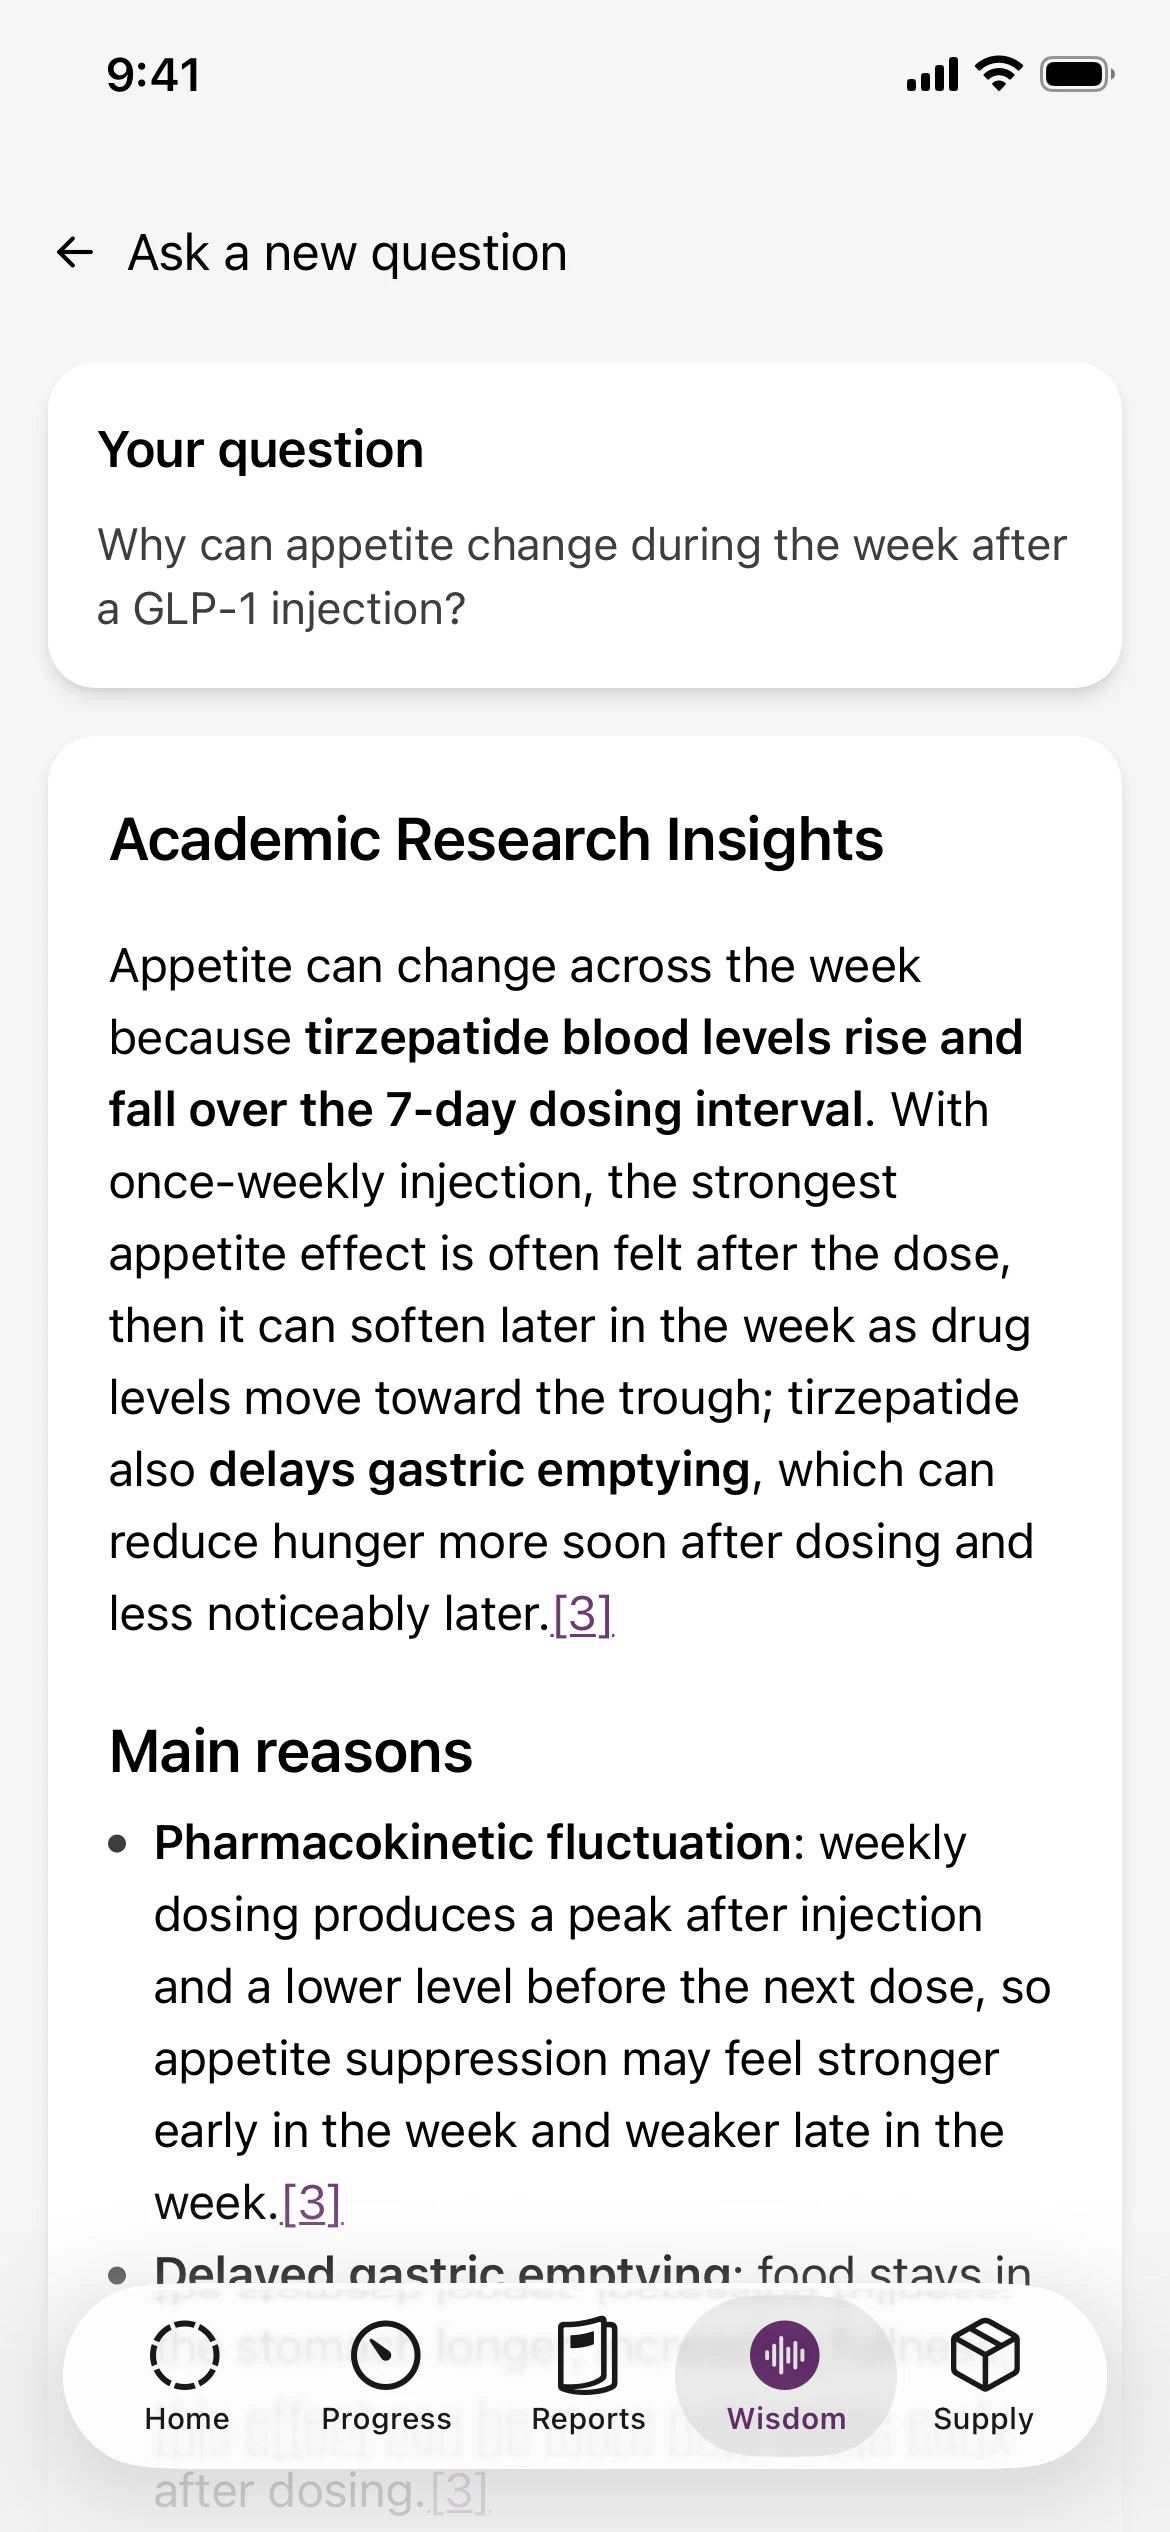
We collaborate with medical doctors to review key features and educational content for accuracy and real-world usefulness.
Our goal is practical, understandable education you can bring into conversations with your care team.
Meet the team behind Glapp“Glapp is the favorite app of our patients.”
Obesity & Lipid Specialist
A clinician’s perspective on Glapp. This testimonial does not establish clinical validation of the phase framework or medication model.
A useful reference explains both a finding and its limits. Here you can explore the studies behind the charts, who took part and how their results appear in Glapp.
Expand a study for its population, dose groups and original source. Sponsor presentations are labeled separately from peer-reviewed publications.
Participants: Adults with obesity, without diabetes.
Shown in Glapp: Shows the average curves for the 2.4 mg and 7.2 mg weekly target-dose groups.
Analysis: Observed averages from participants measured at each visit.
Source: Figure 5: mean change in body weight from baseline to week 72
Read the STEP UP sourceParticipants: Adults with overweight or obesity and established cardiovascular disease, without diabetes.
Shown in Glapp: Shows the semaglutide group average, with a target dose of 2.4 mg weekly.
Analysis: In-trial analysis: includes measurements after participants stopped treatment.
Source: Figure 1a, weeks 0–208
Read the SELECT sourceParticipants: Adults with obesity or overweight, without type 2 diabetes.
Shown in Glapp: Shows the combined tirzepatide group average. Participants used their maximum tolerated weekly dose: 10 or 15 mg.
About the curve: Weekly curve values are approximate.
Read the SURMOUNT-5 sourceParticipants: Adults with obesity or overweight and prediabetes at baseline.
Shown in Glapp: Shows the average curves for the 5 mg and 15 mg weekly target-dose groups.
Source: Figure 10: mean change in body weight from baseline to week 176
Read the SURMOUNT-1 sourceParticipants: Adults with obesity or overweight, without diabetes.
Shown in Glapp: Shows the average curves for the 4 mg and 12 mg weekly target-dose groups.
Analysis: Observed averages from participants measured at each visit.
Source: 2026 Lilly ADA Investor Event, slide 18
Read the TRIUMPH-1 sourceParticipants: Selected participants with baseline BMI ≥35 who completed and tolerated the main trial.
Shown in Glapp: Shows the original 4 mg and 12 mg group averages. After week 80, the 4 mg group increased its dose; both groups targeted a maximum tolerated weekly dose of 9 or 12 mg.
Analysis: Observed averages for the extension participants, followed from week 0.
Source: 2026 Lilly ADA Investor Event, slide 19
Read the TRIUMPH-1 extension sourceThese sources inform educational content; they do not define exact post-injection phase windows.
Measured gastric emptying after a meal, following 12 weeks of treatment.
Early clinical research informing pharmacokinetic context, including its approximately six-day half-life.
Guidance from nutrition, lifestyle medicine and obesity organizations. Read with the 2026 correction.
About one week, according to prescribing information for Ozempic and Wegovy. Peak concentration is reached 1 to 3 days after an injection, and steady state after 4 to 5 weeks of once-weekly dosing. Ozempic describes about five weeks in circulation after the last dose; Wegovy describes about five to seven weeks. These are approximate periods, not exact clearance deadlines. Glapp’s estimated curve uses a 7-day half-life.
About five days, according to prescribing information for Mounjaro and Zepbound. Peak concentration is reached 8 to 72 hours after an injection, and steady state after about four weeks of weekly dosing. Based on this half-life, most is expected to be eliminated in roughly 3.5 to 4 weeks after the last injection. This is an approximation, not a guaranteed clearance time. Glapp’s estimated curve uses a 5-day half-life.
Semaglutide reaches its highest blood concentration 1 to 3 days after injection; tirzepatide reaches it 8 to 72 hours after injection. Glapp’s Peak Effect phase spans hours 24 to 72 for both as an educational window. When you personally feel the strongest effect can differ.
The studies on this page investigate medications and health outcomes. They do not test Glapp as an intervention or validate its phase boundaries and individual estimates. We use them to inform our tools and explain the assumptions behind them.
Phases use your medication and the time since your last shot. They do not measure your appetite or drug levels. Your dose, treatment history, meals and individual response can all affect how you feel. Your own symptom logs provide personal context.
No. Each curve represents an average for a particular study group. Glapp applies the study’s percentage changes to your starting weight for comparison. It is not a personalized forecast, and being above or below a curve does not by itself tell you whether treatment is working for you.
Use Glapp to track and discuss your experience. Medication estimates and phase guidance do not determine a safe dose or injection schedule. Follow your prescription and discuss changes with your clinician.
Have a question about a source? Write to hi@glapp.io
The smart GLP-1 weight-loss tracker built to help you reach your goal weight. Log weigh-ins automatically with your smart scale via Apple Health and Health Connect and visualize your weekly progress.